Zum Inhalt springen
GridBelt
  • Excel-Test
  • Übungen
  • Programme
  • Preise
Anmelden
Kostenlosen Test starten
  • Excel-Test
  • Übungen
  • Programme
  • Preise
AnmeldenKonto erstellen
Kostenlosen Test starten
GridBelt

Excel üben – direkt im Browser.

Excel-Test

  • Stufe 1: Anfänger
  • Stufe 2: Fortgeschrittene
  • Stufe 3: Experten
  • Excel-Test in 7 Tagen
  • Bestenliste
  • Excel-Test im Bewerbungsverfahren
  • Excel-Test von Indeed

Übungen

  • Alle Übungen
  • Programme
  • Für Anfänger

Ratgeber

  • Excel-Formeln
  • Excel-Tastenkombinationen

Unternehmen

  • Über uns
  • Preise
  • So bewerten wir

© GridBelt. Alle Rechte vorbehalten.

  • Datenschutzerklärung
  • Nutzungsbedingungen
  • Rückerstattungsrichtlinie

Excel ist eine Marke der Microsoft Corporation. Indeed, TestGorilla, SHL und andere Marken sind Eigentum ihrer jeweiligen Inhaber. GridBelt ist eine unabhängige Übungsplattform, steht mit Microsoft, TestGorilla, SHL oder Indeed in keiner Verbindung und wird von keinem dieser Unternehmen unterstützt oder gesponsert.

  1. Übungen
  2. /
  3. Charts

Excel combo chart practice: revenue and margin % in one chart

  • Experten
  • ~9 Min.
  • Charts

Übungstext auf Englisch

An outdoor-gear shop reviews its 2026 months: revenue, cost of sales and gross profit are in A1:D13. The shop was closed for a refit in February, so that month has no sales at all. The owner wants revenue and gross margin in one chart. The first attempt (chart A) and the second (chart B) are shown below; both plot the margin column E that you are about to fill.

Two charts titled "Revenue and gross margin, 2026", each with revenue as blue columns and gross margin as an orange line with markers, January to December. Revenue: Jan $41,820, Feb $0, Mar $58,430, Apr $66,910, May $74,250, Jun $88,640, Jul $94,370, Aug $91,280, Sep $70,560, Oct $63,190, Nov $72,840, Dec $89,710. Gross margin: Jan 44.1%, Feb #N/A, Mar 35.2%, Apr 33.8%, May 36.7%, Jun 32.9%, Jul 35.8%, Aug 34.1%, Sep 39.6%, Oct 41.2%, Nov 37.4%, Dec 31.8%. In the upper chart, A, both series share one dollar axis on the left from $0 to $100,000, and the margin line runs flat along the bottom. In the lower chart, B, the dollar axis on the left is unchanged and an axis on the right runs from 0% to 50%; the margin line now rises and falls across the tops of the columns. In both charts Feb has no column and no margin point: the line breaks after Jan and starts again at Mar.

Ihre Aufgabe

  1. 1Gross margin is gross profit divided by revenue. Click E2 and divide D2 by B2.
  2. 2February has no revenue, so a plain division shows #DIV/0! there. Wrap it in IFERROR and give NA() as the value to show instead: the cell then shows #N/A, the value a chart leaves out.
  3. 3Fill E2 down to E13 (double-click the fill handle, or Ctrl+D / ⌘D on the selected range), then format E2:E13 as a percentage with one decimal place: Ctrl+Shift+% (Control+Shift+% on a Mac), then Increase Decimal once (in this grid: the toolbar's Increase decimal places button, under ⋮ when the toolbar is narrow; in Excel, Format Cells with Ctrl+1 / ⌘1 → Percentage → 1 decimal place works too). February stays #N/A.
  4. 4Then answer the questions about the two charts. They are pictures: this practice grid has no chart command.

Antwortzellen

Fragen

Wählen Sie hier Ihre Antworten. „Prüfen“ bewertet sie zusammen mit den Antwortzellen.

  1. Frage 1In chart A, revenue and gross margin share one vertical axis. Why does the margin line lie flat along the bottom?

    Wählen Sie eine Antwort.

  2. Frage 2Chart B shows the same two series after one change. Which change was it?

    Wählen Sie eine Antwort.

  3. Frage 3In chart B the margin line has no point for February, because that margin cell holds #N/A. What would the chart show if the formula returned empty text ("") for February instead?

    Wählen Sie eine Antwort.

  4. Frage 4Which statements about chart B are true? Select all that apply.

    Wählen Sie alle zutreffenden Antworten.

Feedback

Beantworten Sie die Fragen, geben Sie Ihre Formel in die Tabelle ein, drücken Sie Enter und dann „Prüfen“. Wir bewerten Ihre Antworten, den Wert in jeder Antwortzelle und die Formel dahinter.

Aufgaben

  1. Nicht geprüftIn E2:E13, compute each month's gross margin, gross profit ÷ revenue, with one formula filled down; a month without revenue must return #N/A: wrap the division in IFERROR(…, NA()) (or test the revenue with IF).
  2. Nicht geprüftFormat E2:E13 as a percentage with one decimal place (0.0%, for example 35.2%).
  3. Nicht geprüftFrage 1: In chart A, revenue and gross margin share one vertical axis. Why does the margin line lie flat along the bottom?
  4. Nicht geprüftFrage 2: Chart B shows the same two series after one change. Which change was it?
  5. Nicht geprüftFrage 3: In chart B the margin line has no point for February, because that margin cell holds #N/A. What would the chart show if the formula returned empty text ("") for February instead?
  6. Nicht geprüftFrage 4: Which statements about chart B are true? Select all that apply.

Für Tabellenaufgaben empfehlen wir einen Computer. Die Tabelle scrollt innerhalb dieses Rahmens.

StartInsertFormulasDataView
A1fxIhre Arbeitsmappe wird vorbereitet…
A
B
C
D
E
F
G
H
I
J
1
2
3
4
5
6
7
8
9
10
11
12
13
14
15
16
17
18
19
20
21
22
Sheet1

Beantworten Sie die Fragen, füllen Sie die Zellen aus und prüfen Sie.

Über diese Übung

Ein Datensatz mit 12 Zeilen auf einem Tabellenblatt, eine Antwortzelle, etwa 9 Minuten. Bewertet in Ihrem Browser: der Wert und die Formel dahinter, mit Feedback, das die Korrektur benennt. Dazu kommen 4 Multiple-Choice-Fragen, die ebenfalls mit „Prüfen“ bewertet werden.

So lösen Sie die Aufgabe

  • E2=IFERROR(D2/B2,NA())

=IFERROR(D2/B2,NA()) divides gross profit by revenue and, for February's 0 ÷ 0, returns #N/A instead of #DIV/0!; formatted as 0.0% the margins read 44.1%, 35.2% and so on. In chart A the margins (all below 0.5) share a dollar axis built for tens of thousands, so the line looks flat; chart B moves the margin to a secondary axis with its own scale from 0% to 50%. #N/A keeps February out of the line, whereas "" would be plotted as 0%. In chart B you read the margin on the right-hand axis, the crossings of line and columns mean nothing, and the best margin (January) is not the best gross profit (July).

For an existing chart, two routes in Excel 365: right-click the margin line → Format Data Series → Series Options → Secondary Axis (Windows and Mac); or select the chart → Chart Design → Change Chart Type → Combo, set Gross margin to Line and tick its Secondary Axis box (Windows). Insert → Insert Combo Chart → Clustered Column – Line on Secondary Axis builds such a chart from scratch: select A1:B13, add E1:E13 with Ctrl (⌘ on a Mac), and the margin, the second series, becomes the line. Excel 2016–2019 for Windows work the same way; the tab is called Design, under Chart Tools. Use a secondary axis for a second unit, percent next to dollars; two dollar series belong on one axis, or readers compare heights measured against different scales. Add axis titles (Chart Design → Add Chart Element → Axis Titles) so nobody reads the margin against dollars. Charts plot "" as zero, so chart data should return NA(). #N/A never becomes a point. With Select Data → Hidden and Empty Cells → Show #N/A as an empty cell ticked (new charts in Excel 365 have it on) and empty cells shown as Gaps, the line breaks at February, as in chart B; with that box cleared, it runs straight from January to March. For a table people read, a text such as n/a is friendlier (see the IFERROR margin exercise). IFERROR also hides other errors, such as a text value in a revenue cell; =IF(B2=0,NA(),D2/B2) guards only the zero.

Andere Wege, die funktionieren

  • =IF(B2=0,NA(),D2/B2) — guards only the zero revenue and lets any other error show
  • =IFERROR((B2-C2)/B2,NA()) — the margin straight from revenue and cost of sales
  • =IF(ISERROR(D2/B2),NA(),D2/B2) — the pre-2007 pattern, same result

Antworten auf die Fragen
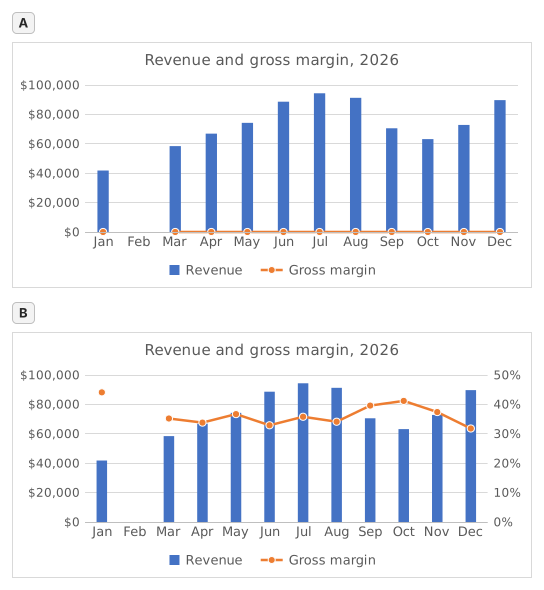
Two charts titled "Revenue and gross margin, 2026", each with revenue as blue columns and gross margin as an orange line with markers, January to December. Revenue: Jan $41,820, Feb $0, Mar $58,430, Apr $66,910, May $74,250, Jun $88,640, Jul $94,370, Aug $91,280, Sep $70,560, Oct $63,190, Nov $72,840, Dec $89,710. Gross margin: Jan 44.1%, Feb #N/A, Mar 35.2%, Apr 33.8%, May 36.7%, Jun 32.9%, Jul 35.8%, Aug 34.1%, Sep 39.6%, Oct 41.2%, Nov 37.4%, Dec 31.8%. In the upper chart, A, both series share one dollar axis on the left from $0 to $100,000, and the margin line runs flat along the bottom. In the lower chart, B, the dollar axis on the left is unchanged and an axis on the right runs from 0% to 50%; the margin line now rises and falls across the tops of the columns. In both charts Feb has no column and no margin point: the line breaks after Jan and starts again at Mar.
  1. Frage 1. In chart A, revenue and gross margin share one vertical axis. Why does the margin line lie flat along the bottom?

    Antwort: Margins below 0.5 share an axis built for dollars

    On one axis every series uses the same scale: the axis runs to $100,000 for the revenue, so margins between 31.8% and 44.1% (0.32 to 0.44 as numbers) sit a hair above zero and every change disappears. The margin did move; it only needs its own scale.

  2. Frage 2. Chart B shows the same two series after one change. Which change was it?

    Antwort: Gross margin series → Format Data Series → Secondary Axis

    Putting the margin on a secondary axis gives it its own scale on the right (0% to 50% here) while revenue keeps the dollar axis on the left. A Maximum of 1 would cut every revenue column off at the top, Display units only relabels the axis in thousands without changing the scale, and Switch Row/Column would turn the months into series.

  3. Frage 3. In chart B the margin line has no point for February, because that margin cell holds #N/A. What would the chart show if the formula returned empty text ("") for February instead?

    Antwort: A point at 0% for February

    A formula that returns "" leaves text in the cell, not an empty cell, and Excel plots text in a line or column series as 0, so the line would dive to 0% in February. #N/A is never plotted as a point: chart B shows it as an empty cell, a gap (Select Data → Hidden and Empty Cells → Show #N/A as an empty cell), and with that box cleared the line would run straight from January to March, still without a February point.

  4. Frage 4. Which statements about chart B are true? Select all that apply.

    Antworten: You read the margin on the right-hand axis und Where the line crosses a column means nothing

    The margin is plotted against the right-hand axis and the revenue against the left-hand one, so a point where the line meets a column only reflects how the two scales happen to be set. The highest margin, January's 44.1%, comes from a quiet month: July's 35.8% on far more revenue earned more gross profit ($33,780 against $18,440).

Häufige Fehler

Using =IFERROR(D2/B2,"") or =IFERROR(D2/B2,0): the table looks tidy, but a chart draws February at 0% and the margin line dives to the bottom; NA() keeps the month out of the chart.

So bewerten wir

Jede Formel, die das richtige Ergebnis liefert, wird akzeptiert, außer die Aufgabe nennt eine Funktion: Dann bringt eine andere Funktion die halbe Punktzahl. Wir vergleichen Werte mit einer kleinen Toleranz und ignorieren bei Text Groß- und Kleinschreibung sowie Leerzeichen. Eine richtige Zahl, die statt einer Formel von Hand eingetippt wurde, bringt die halbe Punktzahl. Aufgaben mit mehreren Zellen bringen die volle Punktzahl, wenn 100% der Zellen stimmen, und die halbe ab 50%. Wo es darauf ankommt, ändern wir außerdem eine Eingabezelle in einer Kopie Ihrer Tabelle und prüfen, ob Ihre Formel mitzieht.

Antworten nach den Regeln von Excel 365 berechnet und am 20. November 2026 in unserem Bewertungssystem geprüft. Verfasst von GridBelt team.

In diesen Programmen

  • Excel test in 7 days, Plan für Stufe 3Tag 6
  • Excel for Data AnalystsTag 11
  • Excel for Accounting and BookkeepingTag 9

Ähnliche Übungen

  • Margin % without #DIV/0!Fortgeschrittene, ~6 Min.
  • Spot a misleading chart axis and measure the real differenceFortgeschrittene, ~8 Min.
  • Share of total per region, formatted as %Anfänger, ~5 Min.

Funktionsreferenz

Offizielle Dokumentation