Saltar al contenido
GridBelt
  • Prueba de Excel
  • Práctica
  • Programas
  • Precios
Iniciar sesión
Empezar la prueba gratuita
  • Prueba de Excel
  • Práctica
  • Programas
  • Precios
Iniciar sesiónCrear cuenta
Empezar la prueba gratuita
GridBelt

Practica Excel en tu navegador.

Prueba de Excel

  • Nivel 1: Principiante
  • Nivel 2: Intermedio
  • Nivel 3: Experto
  • Prueba de Excel en 7 días
  • Clasificación
  • Prueba de Excel para entrevistas
  • Evaluación de Excel de Indeed

Práctica

  • Todos los ejercicios
  • Programas
  • Para principiantes

Guías

  • Fórmulas de Excel
  • Atajos de Excel

Empresa

  • Acerca de
  • Precios
  • Cómo corregimos

© GridBelt. Todos los derechos reservados.

  • Política de privacidad
  • Términos de uso
  • Política de reembolso

Excel es una marca comercial de Microsoft Corporation. Indeed, TestGorilla, SHL y otras marcas son propiedad de sus respectivos titulares. GridBelt es un sitio de práctica independiente y no está afiliado a Microsoft, TestGorilla, SHL ni Indeed, ni respaldado ni patrocinado por ellos.

  1. Práctica
  2. /
  3. Charts

Excel combo chart practice: revenue and margin % in one chart

  • Experto
  • ~9 min
  • Charts

Enunciado en inglés

An outdoor-gear shop reviews its 2026 months: revenue, cost of sales and gross profit are in A1:D13. The shop was closed for a refit in February, so that month has no sales at all. The owner wants revenue and gross margin in one chart. The first attempt (chart A) and the second (chart B) are shown below; both plot the margin column E that you are about to fill.

Two charts titled "Revenue and gross margin, 2026", each with revenue as blue columns and gross margin as an orange line with markers, January to December. Revenue: Jan $41,820, Feb $0, Mar $58,430, Apr $66,910, May $74,250, Jun $88,640, Jul $94,370, Aug $91,280, Sep $70,560, Oct $63,190, Nov $72,840, Dec $89,710. Gross margin: Jan 44.1%, Feb #N/A, Mar 35.2%, Apr 33.8%, May 36.7%, Jun 32.9%, Jul 35.8%, Aug 34.1%, Sep 39.6%, Oct 41.2%, Nov 37.4%, Dec 31.8%. In the upper chart, A, both series share one dollar axis on the left from $0 to $100,000, and the margin line runs flat along the bottom. In the lower chart, B, the dollar axis on the left is unchanged and an axis on the right runs from 0% to 50%; the margin line now rises and falls across the tops of the columns. In both charts Feb has no column and no margin point: the line breaks after Jan and starts again at Mar.

Qué tienes que hacer

  1. 1Gross margin is gross profit divided by revenue. Click E2 and divide D2 by B2.
  2. 2February has no revenue, so a plain division shows #DIV/0! there. Wrap it in IFERROR and give NA() as the value to show instead: the cell then shows #N/A, the value a chart leaves out.
  3. 3Fill E2 down to E13 (double-click the fill handle, or Ctrl+D / ⌘D on the selected range), then format E2:E13 as a percentage with one decimal place: Ctrl+Shift+% (Control+Shift+% on a Mac), then Increase Decimal once (in this grid: the toolbar's Increase decimal places button, under ⋮ when the toolbar is narrow; in Excel, Format Cells with Ctrl+1 / ⌘1 → Percentage → 1 decimal place works too). February stays #N/A.
  4. 4Then answer the questions about the two charts. They are pictures: this practice grid has no chart command.

Celdas de respuesta

Preguntas

Elige aquí tus respuestas: el botón Comprobar las corrige junto con las celdas de respuesta.

  1. Pregunta 1In chart A, revenue and gross margin share one vertical axis. Why does the margin line lie flat along the bottom?

    Elige una respuesta.

  2. Pregunta 2Chart B shows the same two series after one change. Which change was it?

    Elige una respuesta.

  3. Pregunta 3In chart B the margin line has no point for February, because that margin cell holds #N/A. What would the chart show if the formula returned empty text ("") for February instead?

    Elige una respuesta.

  4. Pregunta 4Which statements about chart B are true? Select all that apply.

    Selecciona todas las que correspondan.

Corrección

Responde a las preguntas, escribe tu fórmula en la cuadrícula, presiona Enter y luego haz clic en Comprobar. Evaluamos tus respuestas, el valor de cada celda de respuesta y la fórmula que lo produce.

Tareas

  1. Sin comprobarIn E2:E13, compute each month's gross margin, gross profit ÷ revenue, with one formula filled down; a month without revenue must return #N/A: wrap the division in IFERROR(…, NA()) (or test the revenue with IF).
  2. Sin comprobarFormat E2:E13 as a percentage with one decimal place (0.0%, for example 35.2%).
  3. Sin comprobarPregunta 1: In chart A, revenue and gross margin share one vertical axis. Why does the margin line lie flat along the bottom?
  4. Sin comprobarPregunta 2: Chart B shows the same two series after one change. Which change was it?
  5. Sin comprobarPregunta 3: In chart B the margin line has no point for February, because that margin cell holds #N/A. What would the chart show if the formula returned empty text ("") for February instead?
  6. Sin comprobarPregunta 4: Which statements about chart B are true? Select all that apply.

Para las tareas de hoja de cálculo se recomienda una pantalla grande. La hoja se desplaza dentro de este recuadro.

StartInsertFormulasDataView
A1fxPreparando tu libro…
A
B
C
D
E
F
G
H
I
J
1
2
3
4
5
6
7
8
9
10
11
12
13
14
15
16
17
18
19
20
21
22
Sheet1

Responde a las preguntas, rellena las celdas y comprueba.

Sobre este ejercicio

Un conjunto de datos de 12 filas en una hoja, una celda de respuesta, unos 9 minutos. Se corrige en tu navegador: el valor y la fórmula que lo produce, con comentarios que te dicen qué arreglar. Incluye además 4 preguntas de opción múltiple, que se corrigen con el mismo botón Comprobar.

Cómo resolverlo

  • E2=IFERROR(D2/B2,NA())

=IFERROR(D2/B2,NA()) divides gross profit by revenue and, for February's 0 ÷ 0, returns #N/A instead of #DIV/0!; formatted as 0.0% the margins read 44.1%, 35.2% and so on. In chart A the margins (all below 0.5) share a dollar axis built for tens of thousands, so the line looks flat; chart B moves the margin to a secondary axis with its own scale from 0% to 50%. #N/A keeps February out of the line, whereas "" would be plotted as 0%. In chart B you read the margin on the right-hand axis, the crossings of line and columns mean nothing, and the best margin (January) is not the best gross profit (July).

For an existing chart, two routes in Excel 365: right-click the margin line → Format Data Series → Series Options → Secondary Axis (Windows and Mac); or select the chart → Chart Design → Change Chart Type → Combo, set Gross margin to Line and tick its Secondary Axis box (Windows). Insert → Insert Combo Chart → Clustered Column – Line on Secondary Axis builds such a chart from scratch: select A1:B13, add E1:E13 with Ctrl (⌘ on a Mac), and the margin, the second series, becomes the line. Excel 2016–2019 for Windows work the same way; the tab is called Design, under Chart Tools. Use a secondary axis for a second unit, percent next to dollars; two dollar series belong on one axis, or readers compare heights measured against different scales. Add axis titles (Chart Design → Add Chart Element → Axis Titles) so nobody reads the margin against dollars. Charts plot "" as zero, so chart data should return NA(). #N/A never becomes a point. With Select Data → Hidden and Empty Cells → Show #N/A as an empty cell ticked (new charts in Excel 365 have it on) and empty cells shown as Gaps, the line breaks at February, as in chart B; with that box cleared, it runs straight from January to March. For a table people read, a text such as n/a is friendlier (see the IFERROR margin exercise). IFERROR also hides other errors, such as a text value in a revenue cell; =IF(B2=0,NA(),D2/B2) guards only the zero.

Otras formas válidas

  • =IF(B2=0,NA(),D2/B2) — guards only the zero revenue and lets any other error show
  • =IFERROR((B2-C2)/B2,NA()) — the margin straight from revenue and cost of sales
  • =IF(ISERROR(D2/B2),NA(),D2/B2) — the pre-2007 pattern, same result

Respuestas a las preguntas
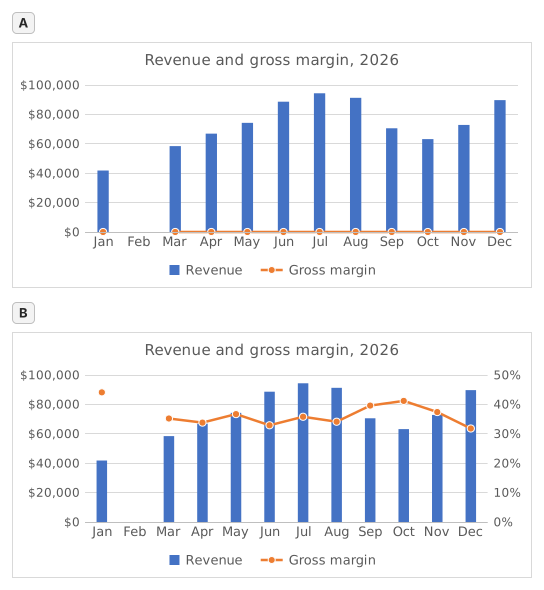
Two charts titled "Revenue and gross margin, 2026", each with revenue as blue columns and gross margin as an orange line with markers, January to December. Revenue: Jan $41,820, Feb $0, Mar $58,430, Apr $66,910, May $74,250, Jun $88,640, Jul $94,370, Aug $91,280, Sep $70,560, Oct $63,190, Nov $72,840, Dec $89,710. Gross margin: Jan 44.1%, Feb #N/A, Mar 35.2%, Apr 33.8%, May 36.7%, Jun 32.9%, Jul 35.8%, Aug 34.1%, Sep 39.6%, Oct 41.2%, Nov 37.4%, Dec 31.8%. In the upper chart, A, both series share one dollar axis on the left from $0 to $100,000, and the margin line runs flat along the bottom. In the lower chart, B, the dollar axis on the left is unchanged and an axis on the right runs from 0% to 50%; the margin line now rises and falls across the tops of the columns. In both charts Feb has no column and no margin point: the line breaks after Jan and starts again at Mar.
  1. Pregunta 1. In chart A, revenue and gross margin share one vertical axis. Why does the margin line lie flat along the bottom?

    Respuesta: Margins below 0.5 share an axis built for dollars

    On one axis every series uses the same scale: the axis runs to $100,000 for the revenue, so margins between 31.8% and 44.1% (0.32 to 0.44 as numbers) sit a hair above zero and every change disappears. The margin did move; it only needs its own scale.

  2. Pregunta 2. Chart B shows the same two series after one change. Which change was it?

    Respuesta: Gross margin series → Format Data Series → Secondary Axis

    Putting the margin on a secondary axis gives it its own scale on the right (0% to 50% here) while revenue keeps the dollar axis on the left. A Maximum of 1 would cut every revenue column off at the top, Display units only relabels the axis in thousands without changing the scale, and Switch Row/Column would turn the months into series.

  3. Pregunta 3. In chart B the margin line has no point for February, because that margin cell holds #N/A. What would the chart show if the formula returned empty text ("") for February instead?

    Respuesta: A point at 0% for February

    A formula that returns "" leaves text in the cell, not an empty cell, and Excel plots text in a line or column series as 0, so the line would dive to 0% in February. #N/A is never plotted as a point: chart B shows it as an empty cell, a gap (Select Data → Hidden and Empty Cells → Show #N/A as an empty cell), and with that box cleared the line would run straight from January to March, still without a February point.

  4. Pregunta 4. Which statements about chart B are true? Select all that apply.

    Respuestas: You read the margin on the right-hand axis y Where the line crosses a column means nothing

    The margin is plotted against the right-hand axis and the revenue against the left-hand one, so a point where the line meets a column only reflects how the two scales happen to be set. The highest margin, January's 44.1%, comes from a quiet month: July's 35.8% on far more revenue earned more gross profit ($33,780 against $18,440).

Errores frecuentes

Using =IFERROR(D2/B2,"") or =IFERROR(D2/B2,0): the table looks tidy, but a chart draws February at 0% and the margin line dives to the bottom; NA() keeps the month out of the chart.

Cómo corregimos

Se acepta cualquier fórmula que produzca el resultado correcto, salvo que la tarea nombre una función: entonces otra función obtiene media puntuación. Comparamos los valores con una pequeña tolerancia y, en el texto, ignoramos mayúsculas y espacios. Un número correcto escrito a mano en lugar de una fórmula obtiene media puntuación. Las tareas de varias celdas obtienen la puntuación completa con el 100% de las celdas correctas y media puntuación desde el 50%. Cuando importa, también cambiamos una celda de entrada en una copia de tu hoja y comprobamos que tu fórmula se adapta.

Respuestas calculadas con las reglas de Excel 365 y comprobadas en nuestro corrector el 20 de noviembre de 2026. Autor: GridBelt team.

En estos programas

  • Excel test in 7 days, Plan del nivel 3Día 6
  • Excel for Data AnalystsDía 11
  • Excel for Accounting and BookkeepingDía 9

Ejercicios relacionados

  • Margin % without #DIV/0!Intermedio, ~6 min
  • Spot a misleading chart axis and measure the real differenceIntermedio, ~8 min
  • Share of total per region, formatted as %Principiante, ~5 min

Referencia de la función

Documentación oficial