Об этом упражнении
Набор данных (строк: 7) на одном листе, одна ячейка ответа, около 6 мин. Проверка прямо в браузере: значение и формула, которая его даёт, с обратной связью о том, что исправить. Также в упражнении есть 4 вопроса с выбором ответа — их проверяет та же кнопка «Проверить».
Как решить
- D2
=(C2-B2)/B2
Growth is the change divided by the starting value: =(C2-B2)/B2 gives the first region's 2026 change as a share of 2025, and filling down to the Total row gives the company's rate to compare with; the 0.0% format shows 0.044 as 4.4%. Reading the chart: the legend says orange is 2026; the biggest dollar increase is the widest gap between a region's two columns (Southeast); the only orange column shorter than its blue partner is Midwest's; and column D shows that Southeast, Southwest and Mountain grew faster than the company.
In Excel: select A1:C7 (leave the Total row out, or its two columns dwarf every region) and choose Insert → Insert Column or Bar Chart → Clustered Column; Excel makes the two year columns the series because the range has more rows than columns. Data labels: Chart Design → Add Chart Element → Data Labels (the tab is called Design, under Chart Tools, in Excel 2016–2019); the number format code #,##0, (Format Axis or Format Data Labels → Number) shows thousands, 879,400 as 879. Pitfall 1: a chart compares heights, so it shows dollar differences; growth in percent needs the calculation, and a small region can grow fastest with the shortest columns. Pitfall 2: if the year headers were numbers instead of text, Excel could plot them as data; clearing the corner cell A1 or storing the years as text keeps them as series names (fix an existing chart with Chart Design → Select Data). Pitfall 3: =C2-B2/B2 without brackets divides first and returns a huge number instead of a percentage.
Другие рабочие способы
- =C2/B2-1 — the same result, shorter
- =(C2-B2)/ABS(B2) — also right when a starting value can be negative (not the case for revenue)
- =IFERROR((C2-B2)/B2,"") — blank instead of #DIV/0! for a region that is new this year
Ответы на вопросы
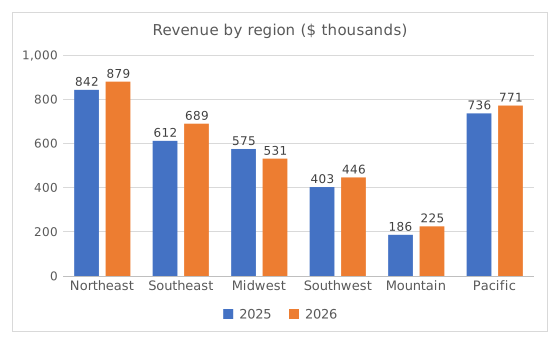
Вопрос 1. In the chart, what do the orange columns show?
Ответ: Revenue in 2026
The legend under the chart maps each colour to a series: blue is 2025 and orange is 2026. A clustered column chart draws one column per series in every category, side by side, so each region gets a 2025 column and a 2026 column.
Вопрос 2. Judging by the chart, which region added the most revenue in dollars from 2025 to 2026?
Ответ: Southeast region
Compare the gap between each region's two columns, not the height of the orange one: Southeast goes from about 612 to 689 thousand, about $78K more, the widest gap. Northeast has the tallest columns but adds only about $37K.
Вопрос 3. Which region's revenue fell from 2025 to 2026?
Ответ: Midwest region
Midwest is the only region whose orange 2026 column is shorter than its blue 2025 column (about 575 down to 531 thousand). Mountain has the shortest columns, but small is not the same as falling: its 2026 column is the taller of its pair.
Вопрос 4. Now look at your column D. Which regions grew faster in percent than the company as a whole (the Total row)? Select all that apply.
Ответы: Southeast region, Southwest region и Mountain region
The company grew by 5.6%. Southeast (12.7%), Southwest (10.8%) and Mountain (20.6%) beat that. Mountain has the highest rate of all although its columns are the shortest: a percentage divides the increase by the starting value, and a small start makes a modest gain a big percentage.
Частые ошибки
Typing =C2-B2/B2 without brackets: Excel divides B2 by itself first and returns the 2026 revenue minus 1 (879,399 for Northeast) instead of a growth rate. Wrap the difference in brackets: =(C2-B2)/B2.
Как мы проверяем
Принимается любая формула, которая даёт верный результат, если только задание не называет функцию: тогда другая функция даёт половину балла. Мы сравниваем значения с небольшим допуском и не учитываем регистр и пробелы в тексте. Верное число, введённое вручную вместо формулы, даёт половину балла. Задания с несколькими ячейками получают полный балл, если верны 100% ячеек, и половину — если верны от 50%. Там, где это важно, мы также меняем входную ячейку в копии вашего листа и проверяем, что формула пересчитывается правильно.
Ответы рассчитаны по правилам Excel 365 и 20 ноября 2026 г. сверены в нашей системе проверки. Автор: GridBelt team.