Pular para o conteúdo
GridBelt
  • Teste de Excel
  • Prática
  • Programas
  • Preços
Entrar
Começar o teste gratuito
  • Teste de Excel
  • Prática
  • Programas
  • Preços
EntrarCriar conta
Começar o teste gratuito
GridBelt

Pratique Excel no seu navegador.

Teste de Excel

  • Nível 1: Iniciante
  • Nível 2: Intermediário
  • Nível 3: Avançado
  • Teste de Excel em 7 dias
  • Ranking
  • Teste de Excel para entrevista
  • Avaliação de Excel da Indeed

Prática

  • Todos os exercícios
  • Programas
  • Para iniciantes

Guias

  • Fórmulas do Excel
  • Atalhos do Excel

Empresa

  • Sobre nós
  • Preços
  • Como corrigimos

© GridBelt. Todos os direitos reservados.

  • Política de Privacidade
  • Termos de Uso
  • Política de Reembolso

Excel é uma marca comercial da Microsoft Corporation. Indeed, TestGorilla, SHL e outras marcas pertencem aos seus respectivos proprietários. O GridBelt é um site de prática independente e não tem afiliação com Microsoft, TestGorilla, SHL ou Indeed, nem é endossado ou patrocinado por eles.

  1. Prática
  2. /
  3. Charts

Excel chart practice: spot a misleading axis that does not start at zero

  • Intermediário
  • ~8 min
  • Charts

Enunciado em inglês

A home-improvement chain surveys its customers every month. The regional manager's slide shows the 2026 satisfaction scores (0 to 100) of five stores as columns on a vertical axis that starts at 95, and one store looks far ahead of the rest; the manager wants to reward it. Before the meeting, measure the real difference in the sheet: the scores are in A1:B6 and the slide's axis minimum is in F2.

Two column charts titled "Customer satisfaction score, 2026" with the same five store scores, each column labelled: Harbor 98.6, Riverside 97.8, Station 95.9, Old Town 97.1, Airport 96.5. Chart A, as on the slide, has a vertical axis from 95 to 99, so each column shows only the part of the score above 95: Harbor's column towers over Station's. Chart B has a vertical axis from 0 to 100, and the five columns look almost the same height.

O que você precisa fazer

  1. 1Click C2 and compare the store with the lowest score of all five: divide B2 by MIN($B$2:$B$6) and subtract 1. The $ signs keep MIN on all five stores when you fill down — F4 (Windows) or ⌘T (Mac) adds them.
  2. 2Fill C2 down to C6, then format C2:C6 as a percentage with one decimal place: Ctrl+Shift+% (Control+Shift+% on a Mac), then Increase Decimal once (in this grid: the toolbar's Increase decimal places button, under ⋮ when the toolbar is narrow; in Excel, Format Cells with Ctrl+1 / ⌘1 → Percentage → 1 decimal place works too). The lowest store shows 0.0%.
  3. 3On a chart, a column is drawn from the axis minimum up to its value, so its drawn height is the value minus the minimum. In F3, divide the drawn height of the tallest column by that of the shortest: (MAX(B2:B6) − F2) ÷ (MIN(B2:B6) − F2). Refer to F2 and do not type the minimum into the formula, so that F3 still works when the axis minimum changes.
  4. 4Then answer the questions; the charts are pictures, because this practice grid has no chart command.

Células de resposta

Questões

Escolha suas respostas aqui: o botão Verificar as corrige junto com as células de resposta.

  1. Questão 1On the slide (chart A), Harbor's column towers over Station's. How much higher is Harbor's score really? Use your column C.

    Escolha uma resposta.

  2. Questão 2You select the slide's vertical axis and open Format Axis (right-click the axis → Format Axis). Which change makes the columns honest?

    Escolha uma resposta.

    The slide's column chart "Customer satisfaction score, 2026", narrower here, with the store names slanted; its vertical axis (95 to 99) is selected, and the Format Axis pane is open at Axis Options. Under Bounds, Minimum shows 95.0 with a Reset button next to it and Maximum shows 99.0 with an Auto button; under Units, Major shows 1.0 and Minor 0.2, both Auto.
  3. Questão 3In which of these charts is a value axis that does not start at 0 acceptable? Select all that apply.

    Selecione todas as alternativas que se aplicam.

Correção

Responda às questões, digite sua fórmula na grade, pressione Enter e depois clique em Verificar. Avaliamos suas respostas, o valor de cada célula de resposta e a fórmula por trás dele.

Tarefas

  1. Não verificadoIn C2:C6, compute how much higher each store's score is than the lowest of the five scores, as a share of the lowest — score ÷ lowest − 1 — with one formula filled down.
  2. Não verificadoFormat C2:C6 as a percentage with one decimal place (0.0%, for example 1.2%).
  3. Não verificadoIn F3, compute how many times taller the tallest column is drawn than the shortest on an axis that starts at the value in F2: (highest score − F2) ÷ (lowest score − F2).
  4. Não verificadoQuestão 1: On the slide (chart A), Harbor's column towers over Station's. How much higher is Harbor's score really? Use your column C.
  5. Não verificadoQuestão 2: You select the slide's vertical axis and open Format Axis (right-click the axis → Format Axis). Which change makes the columns honest?
  6. Não verificadoQuestão 3: In which of these charts is a value axis that does not start at 0 acceptable? Select all that apply.

Recomendamos um computador para as tarefas de planilha. A planilha rola dentro desta caixa.

StartInsertFormulasDataView
A1fxPreparando sua pasta de trabalho…
A
B
C
D
E
F
G
H
I
J
1
2
3
4
5
6
7
8
9
10
11
12
13
14
15
16
17
18
19
20
21
22
Sheet1

Responda às questões, preencha as células e verifique.

Sobre este exercício

Um conjunto de dados de 5 linhas em uma planilha, 2 células de resposta, cerca de 8 minutos. Corrigido no seu navegador: o valor e a fórmula por trás dele, com feedback que mostra o que corrigir. O exercício também traz 3 questões de múltipla escolha, corrigidas pelo mesmo botão Verificar.

Como resolver

  • C2=B2/MIN($B$2:$B$6)-1
  • F3=(MAX(B2:B6)-F2)/(MIN(B2:B6)-F2)

Harbor's score is only 2.8% above Station's (=B2/MIN($B$2:$B$6)-1), but on an axis that starts at 95 a column only shows the part of its value above 95, so Harbor's 3.6 points against Station's 0.9 draw a column 4.0 times as tall (F3). With the axis from 0 the drawn heights are the real values and the ratio falls to 1.03. The fix is to type 0 as the axis Minimum; a non-zero axis is acceptable for lines and dots, which show values by position rather than by length.

In Excel, right-click the vertical axis → Format Axis → Axis Options → Bounds and type 0 in Minimum (the same pane on Windows and Mac, and in Excel 2016–2021). When a bound is on Auto, Excel chooses it: if the smallest value is above about five sixths of the largest, the automatic minimum is not 0, so five scores between 95.9 and 98.6 get a cut axis even if nobody set one, and Reset only returns to that automatic value. The picture shows a 300% difference where the data has 2.8%; Tufte called the ratio of the two the lie factor. When small differences matter, chart them directly: columns of each store's gap to the lowest store or to a target, a dot plot, or a line with a clearly labelled axis. Pitfall: =B2/MIN(B2:B6)-1 without $ slides the MIN range down as you fill, so the stores below Station are compared with a different "lowest" score.

Outras formas que funcionam

  • =B2/MIN(B$2:B$6)-1 — locking the rows is enough when you only fill down
  • =(B2-MIN($B$2:$B$6))/MIN($B$2:$B$6) — the same, written as (score − lowest) ÷ lowest
  • =(MAX(B2:B6)-$F$2)/(MIN(B2:B6)-$F$2) in F3 — the same with F2 locked

Respostas às questões
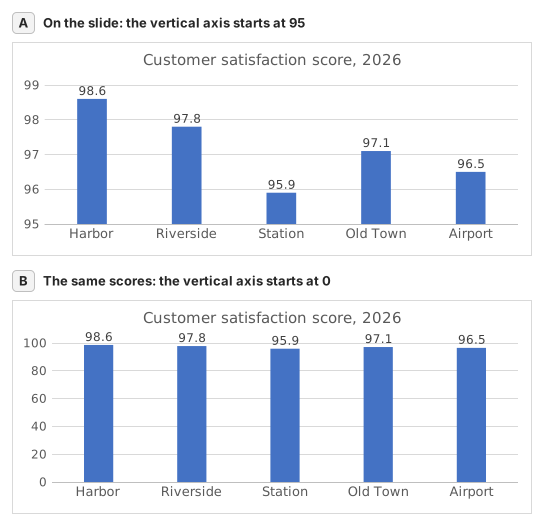
Two column charts titled "Customer satisfaction score, 2026" with the same five store scores, each column labelled: Harbor 98.6, Riverside 97.8, Station 95.9, Old Town 97.1, Airport 96.5. Chart A, as on the slide, has a vertical axis from 95 to 99, so each column shows only the part of the score above 95: Harbor's column towers over Station's. Chart B has a vertical axis from 0 to 100, and the five columns look almost the same height.
  1. Questão 1. On the slide (chart A), Harbor's column towers over Station's. How much higher is Harbor's score really? Use your column C.

    Resposta: About 3% higher

    Harbor scores 98.6 and Station 95.9, so Harbor is 98.6 ÷ 95.9 − 1 ≈ 2.8% higher. On the slide each column only shows the part above 95: 3.6 points against 0.9, which draws Harbor's column 4.0 times as tall.

  2. Questão 2. You select the slide's vertical axis and open Format Axis (right-click the axis → Format Axis). Which change makes the columns honest?

    Resposta: Type 0 in the Minimum box

    Columns show a value by their length from the axis, so the axis must start at 0 for the lengths to compare. Reset is not enough: when every value is above about five sixths of the largest one, as here, Excel's automatic minimum is not 0 either. Data labels print the true numbers but leave the misleading lengths.

  3. Questão 3. In which of these charts is a value axis that does not start at 0 acceptable? Select all that apply.

    Respostas: A line chart of a share price moving between $95 and $99 e A scatter chart of house size against sale price

    Columns and bars show a value by their length, so a cut axis turns small gaps into big ones. Lines and dots show a value by its position, so their axis may zoom into the range where the values move, as long as its labels show where it starts.

Erros comuns

Filling =B2/MIN(B2:B6)-1 down without $: in the rows below Station the MIN range no longer includes Station's score, so those stores are measured against the wrong lowest store.

Como corrigimos

Qualquer fórmula que produza o resultado certo é aceita, a menos que a tarefa cite uma função: nesse caso, outra função vale metade da pontuação. Comparamos os valores com uma pequena tolerância e ignoramos maiúsculas e espaços no texto. Um número certo digitado à mão em vez de uma fórmula vale metade da pontuação. Tarefas com várias células valem a pontuação integral com 100% das células certas e metade a partir de 50%. Quando faz diferença, também mudamos uma célula de entrada em uma cópia da sua planilha e verificamos se sua fórmula acompanha.

Respostas calculadas com as regras do Excel 365 e verificadas no nosso corretor em 20 de novembro de 2026. Autor: GridBelt team.

Exercícios relacionados

  • Read a clustered column chart of revenue by regionIniciante, ~6 min
  • Year-over-year % changeIniciante, ~4 min
  • Revenue and margin % in one readable chartAvançado, ~9 min

Referência da função

Documentação oficial

Próximo exercício

Series or categories? Read a chart both ways and flip its table